Counting Things that Count Assessing the Fundamental Missions of Research and Development Organizations
Counting Things that Count Assessing the Fundamental Missions of Research and Development Organizations
- Details
- Published: Thursday, 07 April 2022 00:34
- Written by James J. Richardson, PhD
- Hits: 2877
Introduction
 The best competitors in any facet of life—whether businesses, schools, athletic teams, or individuals—understand that to succeed, they must clearly know what they do and how well they do it. This specialized wisdom to succeed applies equally to organizations that support research and development (R&D). Success requires insight from repeated analysis, mission prioritization, and dedication to development and incorporation of objective performance measures. This is true regardless of the field of activity, size, scope, or importance of the performing organization, but it is especially true for organizations that sponsor or perform R&D. Assessments are particularly difficult for R&D organizations because they provide complex services and often have long-term outcomes and sponsors with immediate expectations.
The first component of the assessment is the mission statement, which cites individual goals of an organization. Those goals, often addressed under constituent (lower-order) missions, are met through the employment of organizational functions. Organizational functions, or simply “functions,” may be R&D-oriented, such as transitioning S&T into active systems, or management-oriented, such as meeting budget obligations, managing contracts, and promoting workplace diversity through hiring policies.
Although both types of functions are important to the assessment process described later, R&D functions are more challenging to evaluate than management functions for several reasons. Management functions are more quantifiable and, therefore, more open to comparative evaluation. Management functions consist of well-documented processes with built-in standards of success (as opposed to R&D in the science and technology [S&T] fields that can focus on esoteric subject matter with unproven utility). Management functions are overseen by specialists trained to identify well-known problem indicators. These individuals operate under management supervision as well as headquarter and corporate leadership. Accordingly, organizations often turn to measuring what is more easily measured—those functions associated with management. But while management functions are important to organizational effectiveness, they seldom directly measure an organization’s fundamental output. Therefore, the value of functions related to technical output (“technical functions”) should be the principal performance assessment focus for mission accomplishment. Indeed, on-time budget processing and excellent hiring strategies do not matter if the organization fails to advance its R&D mission.
This article outlines a performance evaluation methodology for an R&D organization in accomplishing its primary (technical) responsibilities, while considering other important aspects of program management. An R&D organization should advance S&T in accordance with its mission for the benefit of its parent sponsor. In some cases, the sponsor is the nation; in other cases, it might be a specific military service or corporation.
We will focus on a fictional R&D organization dedicated to developing and delivering S&T to service a parent establishment. The organization features divisions that collectively work various technology areas and which, through affiliations with a local university, perform scientific explorations. The organization may be government or private sector (we assume the latter has government R&D contracts).
The mission areas of such an organization may include:
- Transition S&T into active systems,
- Provide on demand technical support to components of a parent organization, and
- Discover scientific truths.
Before providing an assessment template, consider why we might want to conduct a performance assessment in the first place. Most members of an R&D organization will simply want to do their work and will find the overhead of an assessment annoying. Furthermore, data collection and analysis will be costly and there is no guarantee that the assessment will be actionable. So why do it? Likely, because it will be required. Leadership must offer objective evidence of the organization’s utility to maintain the investments required for continuing R&D. Assessments help in setting priorities, and thus maximizing benefit. Trends within certain performance parameters can help management know where changes need to occur to gain improvements. Self-reflection, even for an organization, can be beneficial. But the costs should not outweigh the potential benefits.
We will next outline a three-step approach to accomplish the assessment. The first two steps discuss how mission and performance might be defined to facilitate an assessment. The third step provides thoughts on the design and execution of the assessment process itself.
Assessing an R&D Organization
Defining and Prioritizing Mission Areas
Developing a tailored assessment process begins with understanding and prioritizing the overall organizational mission by identifying the critical components, which we will call critical missions. “Critical missions” define the organization’s essential purposes and establish the expected output. The parent organization’s mission must also be considered since the critical mission areas must clearly represent a principal benefit to the parent organization.
This prioritization reduces the burden of assessing every individual constituent mission—an onerous task, even for the most dedicated analyst. It also facilitates a regular review of the important mission components to ensure that they remain valid. This is often necessary when an organization’s mission statement is subject to change, expansion, or scope reduction due, for instance, to mission oversimplification (“making a profit”) or overstatement (“delivering the ultimate technology products”). These possibilities should be factored into the mission review.
Defining Critical Functions
We suggest identifying all the functions involved in serving the organization’s critical mission, which often demands describing the organization and how it addresses its critical missions. Sometimes for example, there are business units for separate customer-related mission areas; or divisions with separate technical areas of expertise, which are matrixed to output functions, each serving a critical mission.
Such a task will typically produce pages of functions, some of which may seem too infrequently performed or trivial. But combined with others, these functions may be worth considering. To focus on an acceptable level of effort, two priorities are targeted. One of these, discussed above, involves the relative importance of the mission, leading to its designation as a critical mission. The other depends on the degree to which a function may be labeled a “critical function” that robustly addresses a critical mission.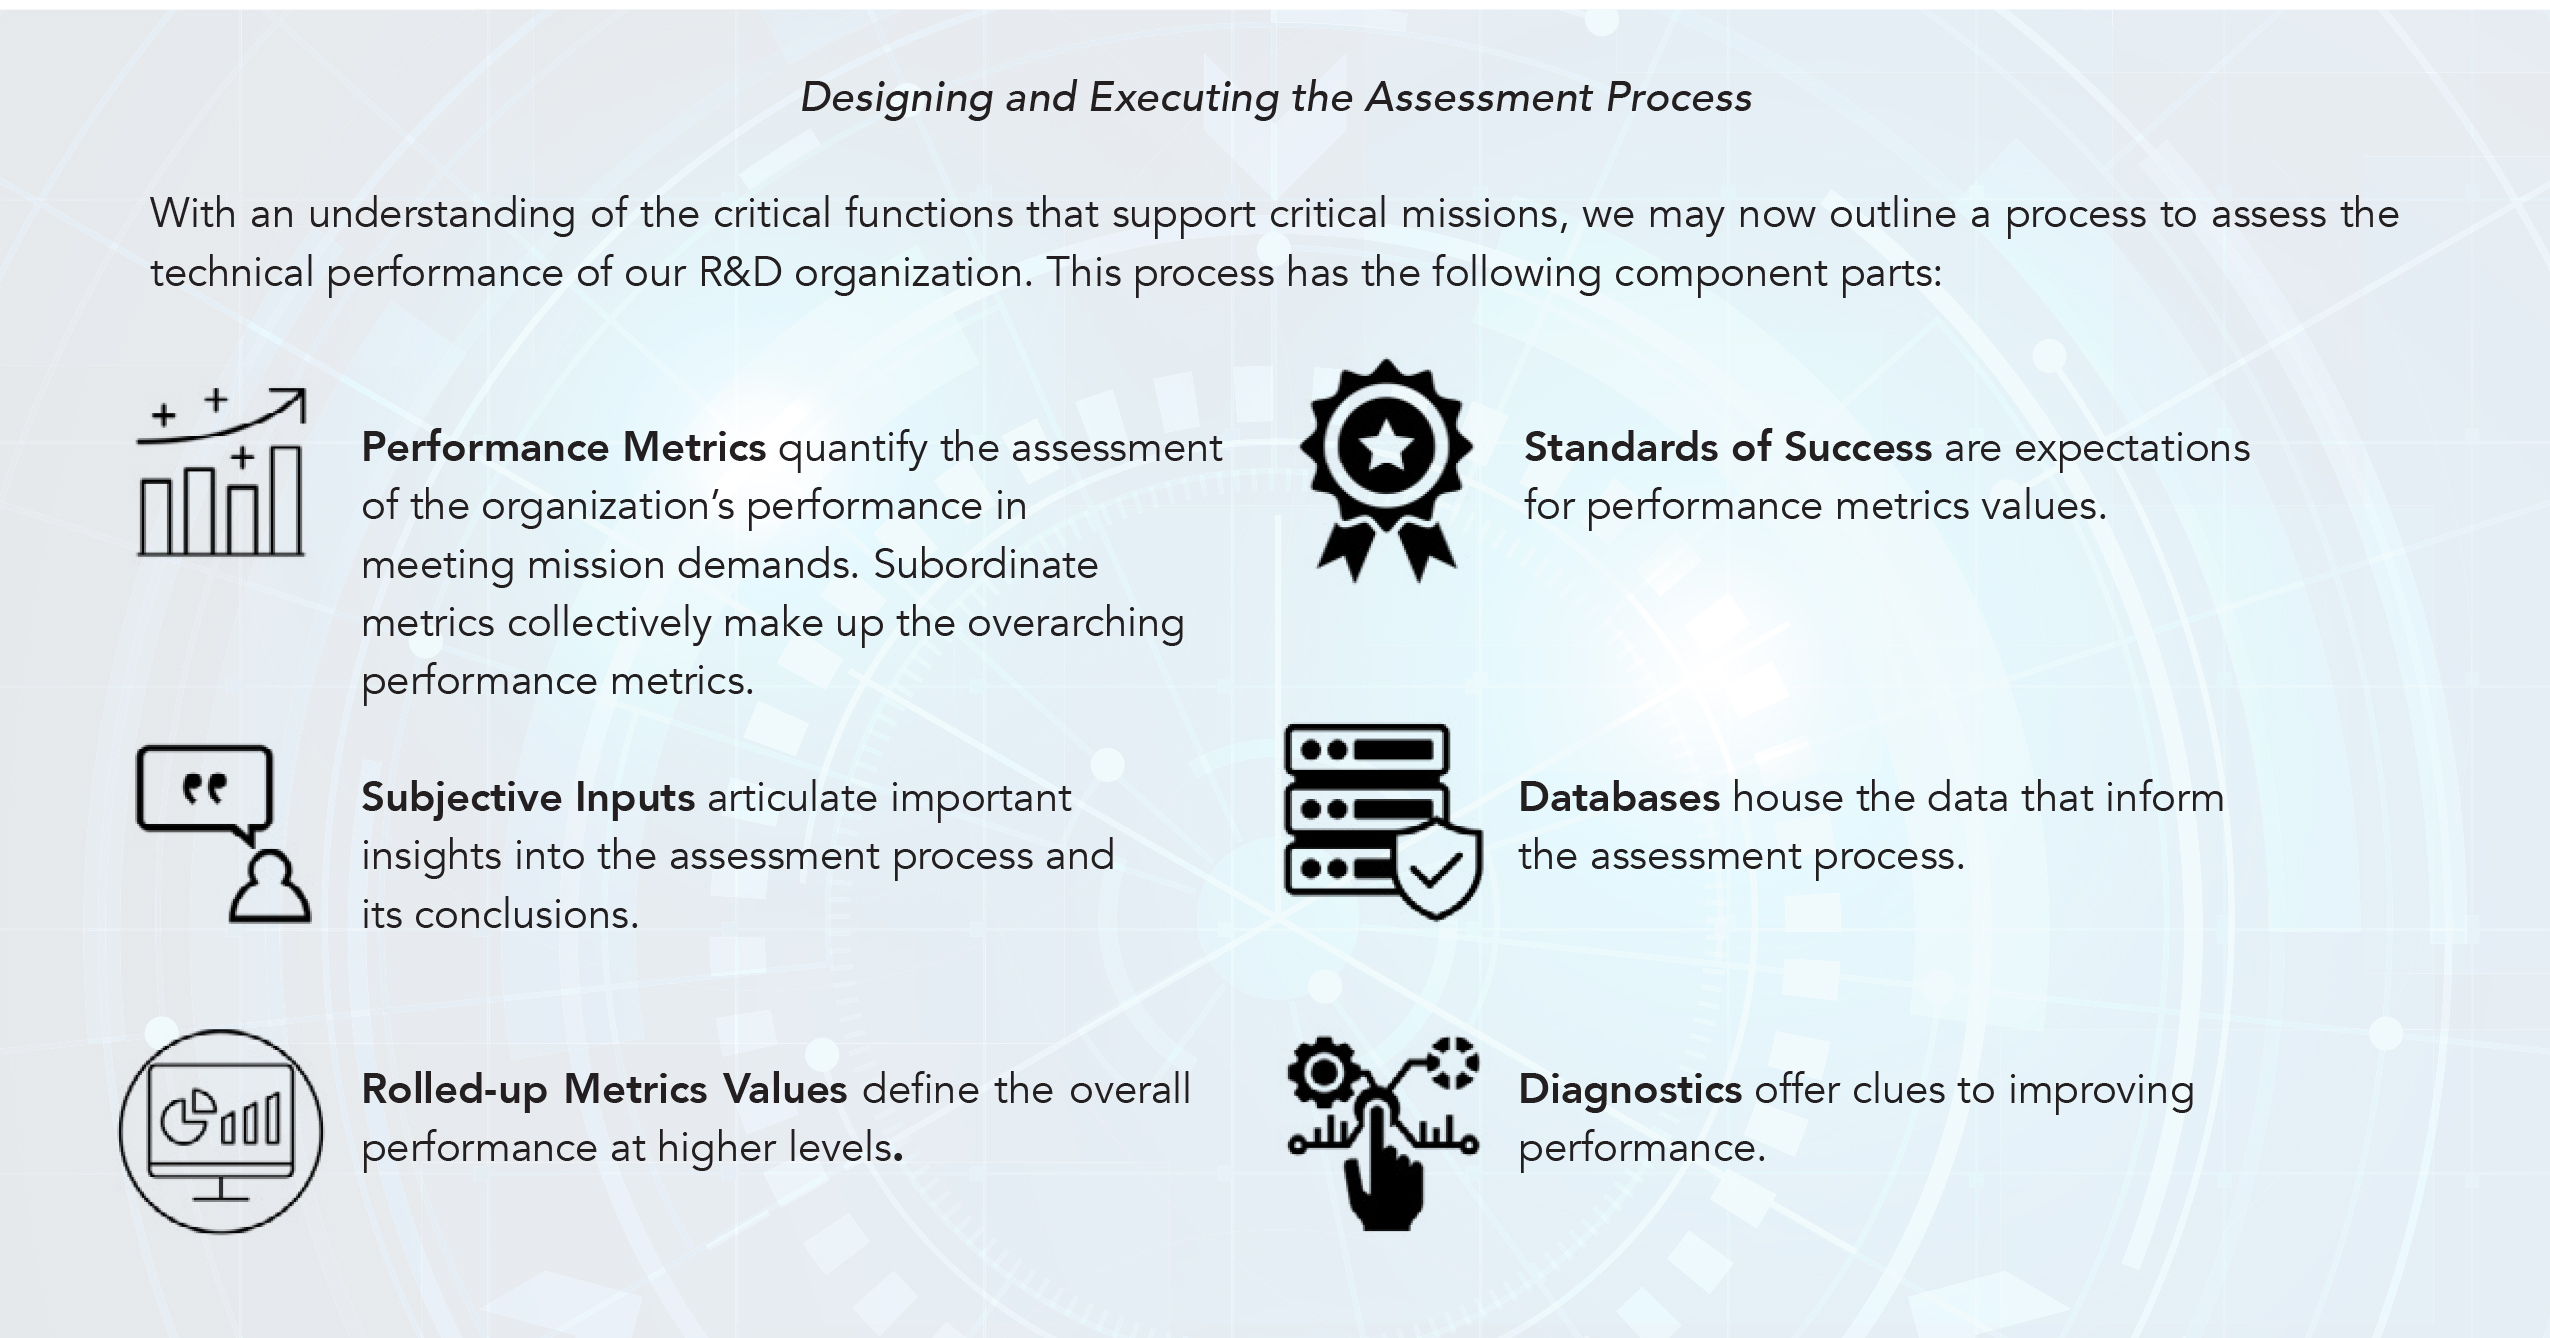
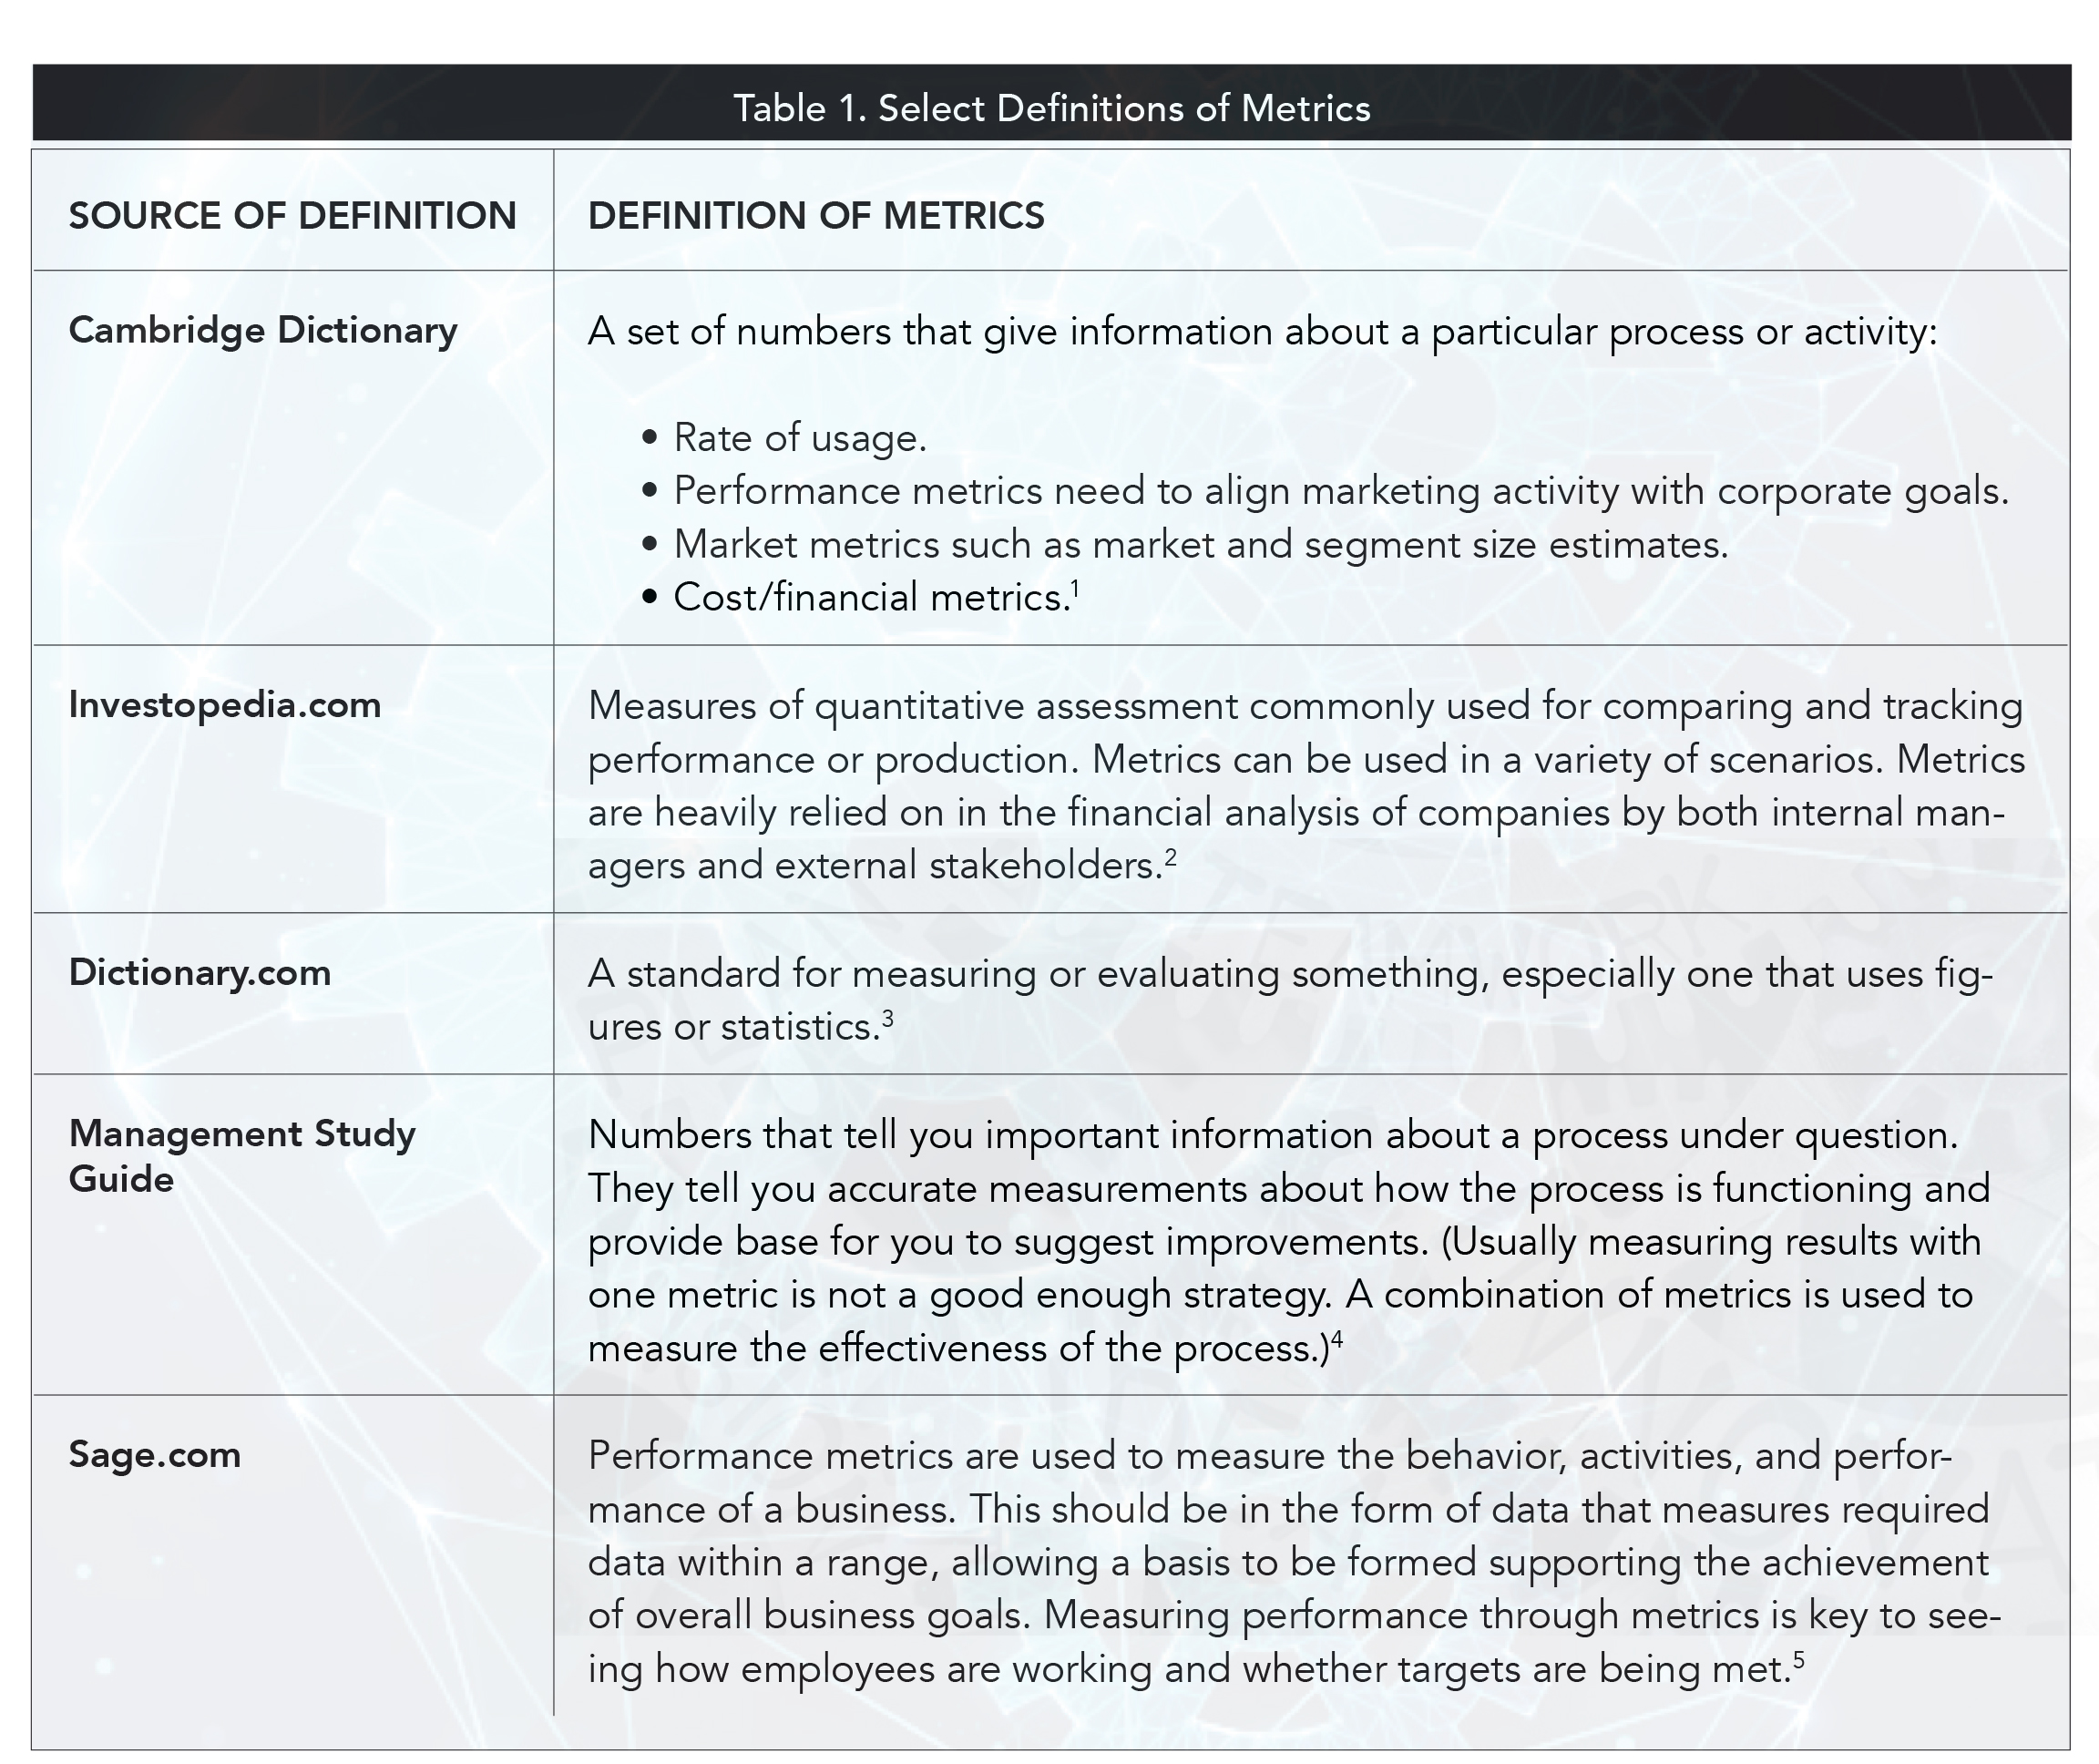
Performance Metrics
The first component in this list is performance metrics, which measure the performance of critical functions. There are many uses for, and definitions of, metrics (see Table 1), but for our purposes, metrics quantify the performance of functions in supporting missions. While metrics ask, “how much,” performance metrics address “how well.” Performance metrics can assess management functions, such as contracting or human resources, or technical functions, such as prototyping or technology integration. For the R&D organization, technical function metrics are most relevant to the assessment process. The selection of technical metrics will dictate which data should be collected and how the metrics are integrated into an overall assessment.
Performance metrics tend to be quite complex, requiring extensive data collecting, tracking, analysis, and synthesis. But they represent a unique opportunity to quantify current levels of performance. Even though we will focus on technical performance metrics, management performance metrics may also be employed. For example, a “gender performance metric” may be defined as “the balance of gender representation in the workplace” to grade the organization’s performance in arriving at an appropriate level. Management techniques designed to improve performance of critical functions should be recognized in assessments.
Subjective Inputs
Subjective inputs, which include vignettes (or case histories) and customer endorsements, can provide important insights into the value of a function. There are numerous types and sources of subjective assessment factors. Surveys are often used to provide customer-based judgements on products and services, and vignettes can illustrate specific accomplishments and explain their value. While quantification provides the specificity and comprehensiveness on which to base an objective evaluation, subjective descriptions allow articulating the details of exciting facts and promises of S&T breakthroughs and adaptations to useful employment.
Subjective findings are valuable, and external independent evaluators might provide ways to convert them into numbers, but this is often viewed as an art form and subject to skepticism. However, in certain cases, vignettes can be subjected to formulas that compare the effort expended on a project to its impact upon completion. Impact is a key factor in a performance assessment, but its contribution is difficult to quantify. In an R&D organization, the impact often occurs much later than when the product emerges (e.g., after crossing the so-called “valley of death”), which further complicates the assignment of values.![shutterstock 584835841 [Converted] copy 2](/steps/images/Articles/shutterstock_584835841%20[Converted]%20copy%202.jpg)
Rolling-up Metrics Values
The most contentious problem with a metrics-based assessment is how to derive (or “roll-up”) the higher-level metrics values from those of the subordinate metrics measuring the individual actions, such as each transitioned technology or product. These measurements collectively define the overall performance. Perhaps it is best to explain this process using the accompanying example.
Describing transition performance begins with deriving a value for each of the six subordinate metrics. This can require setting their values for every transitioned item. The “Number of Transitions” and “Transition Rate” subordinate metrics are easy to handle, as they only require summation, but the other four demand that values be calculated for each transition. Each of the transitioned items will have its own impact, transition time, maturity, and cost, and each of these must be derived individually and then rolled up to define their contribution to subordinate metrics (e.g., “Maturity Metric”). Then, it must be decided how each subordinate metric contributes to the “Transition Performance Metric.” The subordinate metrics supporting the “Technical Support” and “Science Performance” metrics require a similar process. This roll-up process is wickedly difficult and requires a case-by-case approach. It also demands a rich database with good retrieval capabilities, as suggested below.
Calculating a single performance metric value to describe the overall effectiveness of the organization in addressing its mission may be desirable. For instance, one could reach the judgement that the organization operates at an overall level of 85% effectiveness. This is, of course, a challenging judgement, demanding that each performance metric contribute to an overarching one in such a way that it predicts an overall potential. One might, for example, take a weighted linear combination of normalized performance metrics, but then one must decide what weight each metric carries. This often requires the ubiquitous comparison of “apples and oranges” if there is too much dissimilarity.
Standards of Success
Expectations must be set for performance metrics, subordinate metrics, and each project or program. For example, the number of transitioned technologies would mean nothing to an outside observer unless they knew how many transitions were expected. Standards of success should reflect the expectations of the organization and should be flexible to accommodate changing circumstances and priorities. Beyond the normal bureaucratic method of choosing last year’s norms as this year’s quota, management must set standards for success objectively. Current challenges may differ from those that dominated previous efforts, so standards of success may change. In developing expectations for success, one must understand the circumstances under which the organization operates, such as competing activities for which they are responsible. Also, greater values for some metrics may lower those for others.
Databases
Assessments require burdensome and costly data collection and analytical processes. To reduce these, links should be established to databases maintained for other purposes, such as supporting program records or management reviews. Also, new concepts such as a “lake” of databases, data analytics, text analytics, and automated information extraction can lead to greater efficiencies. Modern database management systems are a must. It should be possible to develop automated techniques to find correlates of such files with performance metrics, such as opportunities or probabilities for transition. While every R&D project should confront problems, success is not guaranteed. Statistical indicators of progress across projects might be extractible from “web crawlers” and data analytics. These approaches can improve efficiencies while being less intrusive, but one should remain skeptical of the output without further application of sound judgement. Computer aids to extract, analyze, and synthesize results can offer information, but the processing to extract wisdom will be labor intensive.
Diagnostics
In addition to providing insights into cause and effect, diagnostics may offer clues to improving performance. Diagnostics can be used to explain reasons behind current performance levels and to aid in assessing the effectiveness associated with strategies for improving performance. Diagnostics are not metrics but are indicators that can contribute to the success of an organization by acting as signposts pointing to what works and what does not work. For example, prototype testing could be included as a diagnostic for transition performance. Potential means to improvement should be analyzed or tested for positive or negative impacts on performance.
Technical Performance Metrics with Subordinate Metrics Examples
We provide examples of technical performance metrics of critical missions using our notional R&D organization. We express each performance metric in terms of subordinate metrics, such as “number of transitions.” Critical performance and subordinate functions in this example were chosen from many alternatives, such as “technology transfer” and “degrees conferred.” These incorporate organizational expertise and skillsets necessary to meet performance standards. Only after a thorough review of the critical mission will the performing organization understand which of these functions require measurement.
1. Transition Performance Metrics
Transition is frequently the key metric for R&D organizations. And yet, it can be the most difficult to measure. The six subordinate metrics listed below can contribute to an overall “Transition Performance Metric.” At the core, however, it is the quality and impact of the transition that matters. This is often subjective, and not directly available to the organization. When assessing the value of a broad spectrum of transitioned products, degrees of scale, quality, and impact will vary widely.
Further, “transition” should be defined in each case to indicate whether the technology delivered is incorporated into a product used by operators, or simply moved to the next level of development. True transitions require a user or customer to “put skin in the game.” Namely, it requires integration of the technology or product into their systems—an action that might be measured by the amount of funding devoted to development or integration.
With a suitable definition of “transition,” the following subordinate metrics will produce the higher-order Transition Performance Metric:
- Number of Transitions Metric: The number of transitions successfully accomplished.
- Transition Rate Metric: The rate of transitions per attempt. In an assessment, the question most often asked is, out of all attempts or programs, how many were successful? This metric provides the answer for transition. The standard of success might not be a high rate, as too high a success rate may indicate a lack of risk tolerance.
- Maturity Metric: Technology maturity is a significant indicator of transition potential and is typically measured on a scale of the Technology Readiness Level.*
- Transition Time Metric: The time to insert a product after a transition decision is made should consider the time needed to realize returns from a research investment. External factors can affect the transition process, such as the state of the technology, the threat environment, or the state of available funding.
- Impact Metric: This, most difficult but most important metric of transition, can be measured by its impact on the customer or, more specifically, on the customer’s capabilities.
- Cost Metric: The cost of a transition depends on such variables as the complexity of the transitioned item and the efficiency of the transition process. These variables make predictions of return on investment difficult and often encourage contingency efforts that may never directly pay off.
* A performance assessment may depend on many aspects of an achievement. An organization that does superb discovery and development may not be perceived as successful if its output is never transitioned into use. This does not necessarily mean failure. Payoff is still possible if the results are preserved “on-the-shelf” for a later contingency, relegating the judgement to another realm of decision makers.
2. Technical Support Performance Metrics
Technical support can be an “unsung” role for an R&D organization. Although more difficult to track due to the many activities represented, these are often vital to the parent organization, providing an expert pool of researchers that can be called upon to solve pressing issues. Innovation can play a vital role in this function.
As with the definition of a transition, the organization should carefully define and analyze all support activities, such as:
- Smart Buyer Metric: Support involves helping organizations make smart purchases, acquisitions, or mergers. These activities ensure that acquisition yields the best deals and most effective products. An example is participation in source selection processes. Weighting factors can be defined by the size of the subject of the selection and the relative contribution represented by the technical support, which will usually involve a subjective component.
- Technical Assistance Metric: Technical personnel are often assigned to provide expertise as direct customer support. Technical assistance tasks are widely varied and may include problem-solving, testing, or advising on proposed system modifications. These tasks often require very high expertise in a particular technical area, as well as experience with the organization’s technologies or product line.
- Patents Metric: Inventions are an indication of creativity, which can allow the organization free use of the technology or idea and can produce royalty revenue. The review process for a patent requires a threshold of evaluation, and thus, the number of patents can be a useful metric for an organization involved in technology development for future applications.
3. Science Performance Metric
By definition, basic research is conducted without a strong notion of intended application. Thus, basic research can be difficult to justify, especially when budgets become challenged. Yet, the discovery of S&T capabilities can have fundamental and pervasive applications. When assigning credit to new products, prior scientific advances are often overlooked, regardless of whether they contributed to a novel technology or a better understanding of the physical world. Nonetheless, payoffs of scientific discoveries can be enormous. For example, quantum theory is the underpinning of the development of the transistor, which led to microelectronics, personal computing, smart phones, and connected communications. Similarly, stealth technology, GPS, lasers, light emitting diodes, and other advancements all began with scientific breakthroughs.
At issue then, is how do we account for the value of scientific discovery when the applications and impact might be far in the future?* It is a practical question, because when budgets are tight, basic research is often the first to get squeezed. The scientific enterprise has developed its own metrics, which are relevant to organizations other than university departments:
- Proof of Principle Metric: A critical step in a discovery process, the scientific process requires testing the hypothesis. A carefully designed test, especially to determine the proof of principle, is a threshold to deeper exploration of a scientific truth. Counting of successful proofs of principle can provide a measure of the quality of intuition and discovery.
- Publications Metric: The number of publications, especially peer reviewed publications, is an established indicator of successful research activity.
Way Forward
Carefully analyzed performance metrics will continue to help in priority adjustments and decision processes. They will allow a rationale for choosing new paths and taking risks, or for defending existing missions and budgets. As related technologies improve, the collection of data and maintenance of sharable databases will increase communication and coordination among an organization’s divisions. This will enable both competition and the sharing of mutual goals, priorities, and lessons learned. Assessments will be a tool for raising awareness of contributions, successes, and problems at the organization and division levels, as well as providing reasons for changes that will increase contributions and mitigate problems. Those benefits will accrue to the researchers, staff, and top executives.
Benefits will also accrue to customers and deepen their appreciation for value delivered, reminding them of ways the organization has supported them. It is sadly true that individual vignettes of even heroic contributions are often quickly lost in history. Quantified assessments at the program, directorate, or laboratory level stand as easily referenced judgements of the cumulative effects of those contributions.
It is likely that basic research would be more appreciated if there were metrics that could better predict the opportunity for future applications. Everyone agrees that basic research is a good thing, but that it often takes decades to mature. Thus, retrospective analysis is often the best means to justify basic research and the discovery components of R&D organizations, since it tracks past events into the present. But the need to predict success or failure far into the future applies to all aspects of R&D. The further in the future, the less certain is the estimate.
As a surrogate for a valuation of future transition, it is now common to attempt to assess the “innovativeness” of a discovery, idea, or advancement. Even given the risk that can accompany innovation, an innovative development can increase the likelihood of large payoffs for future transitions. Indeed, many of the game-changing technological advances of the last century were associated with multiple developments that could be labeled as innovative. However, this leaves open the questions of how to define innovation, identify it, and quantify and assess the degree of innovativeness. This is not to mention the difficulty of determining if a particular innovation really does presage useful purpose. Thus, while there is hope that innovativeness could become a useful performance metric, its utility is yet to be proven.
Calls for assessments of organizations is increasing, including (or maybe especially) for R&D organizations. However, countervailing pressure demands that assessments be efficient (less costly) and as accurate as possible—and that they include performance metrics. Less burdensome and more efficient assessments are possible through careful selection of mission areas, limiting inclusion of projects and program areas, less frequent assessments, and the use of outside independent assessors to reduce interruption to ongoing processes. Nonetheless, the demand and need for performance assessments continues.
Endnotes
1. Cambridge Business English Dictionary, https://dictionary.cambridge.org/us/dictionary/english/metrics.
2. Investopedia, https://www.investopedia.com/terms/m/metrics.asp#:~:text=Metrics%20are%20measures%20of%20quantitative%20assessment%20commonly%20used%20for%20comparing,internal%20managers%20and%20external%20stakeholders.
3. Dictionary.com. https://www.dictionary.com/browse/metric#:~:text=Often%20metrics%20.,pretty%20good%20by%20any%20metric.
4. Management Study Guide. https://www.managementstudyguide.com/what-are-metrics.htm
5. Sage.com. https://www.sage.com/en-us/blog/glossary/what-are-performance-metrics/#:~:text=Performance%20metrics%20are%20used%20to,achievement%20of%20overall%20business%20goals.