Education of Americans Across Various Generations as a Preparation for Global Competitions
Education of Americans Across Various Generations as a Preparation for Global Competitions
- Details
- Published: Wednesday, 24 August 2022 04:23
- Written by The Honorable Alan R. Shaffer, Trevor Huffard
- Hits: 3486
 Introduction
Since the end of World War II over 70 years ago, the United States has led the world in technology development. The US spearheaded the development of capabilities (in space and with semiconductors, computers, lasers, etc.) and the education of generations of new scientists and engineers. Today, this leadership is under threat. The US needs to seriously reconsider its educational system to include both the results (outputs) and the associated research and development (R&D) investments that support and drive the system. Although the US maintains its global R&D leadership, US student performance in science, technology, engineering, and mathematics (STEM) may not be strong enough to sustain US educational leadership in the future technology competition on the world stage. The ongoing global competition for science and technology superiority has economic, military, and geopolitical consequences, and education and R&D investments are the most important levers of influence.1
Mega Trends in Global R&D Investment
American preeminence in science and technology has not happened by chance. Sustained commitments to education and investments in basic research have played key roles in establishing and maintaining the knowledge ecosystem and innovation driving US partnerships among academia, government, and the private sector. To compete in the global economy going forward, the US needs to renew its commitment to strengthen these key components of our national infrastructure.
The US share of global investments in R&D has contracted in the post-World War II era, dropping from 70% of global R&D investments in 1960 to less than 30% in 2019. This occurred despite the fact that US federal R&D funding (in constant 2020 dollars) increased from $81B in 1976 to over $164B in 20202. During the same period, total US R&D funding, including corporate and non-federal funding, rose from under $250B3 to almost $500B. But, at the same time, the increase in total R&D investment in the rest of the world has dramatically surpassed the rate of increase in the United States (see Figure 1). For example, during 2000-2017, the Compound Annual Growth Rate (CAGR) in R&D was nearly 18% in China and about 10% in South Korea. This compares to a US CAGR of 4%. China is soon to overcome the United States in total R&D spending (see Figure 2).
It is not just total investment that has changed, but also the ratio of public to private investment in R&D. Today, public (government) investment has dropped to less than 30%; private sector (business, industry) investment continues to provide the growth in US R&D investment (see Figure 3). This shift changes the focus from scientific discovery to product development. To remain competitive, America needs to also invest in scientific discovery.
“Since World War II, advancements in science and technology have driven much of our economic growth, underpinned our national security, and transformed nearly every aspect of Americans’ daily lives. New technologies built on federally-funded discovery research have led to new businesses, revolutionized health care, and created the mobile, digital world.”
Diane Souvaine, Chair of the National Science Board,
before a Hearing of the House Committee on Science, Space and Technology on Jan 29th, 2020.
Figure 1. Compound Average Growth Rate Percentage of Domestic R&D Expenditures, by Country/Region 2000-2017.
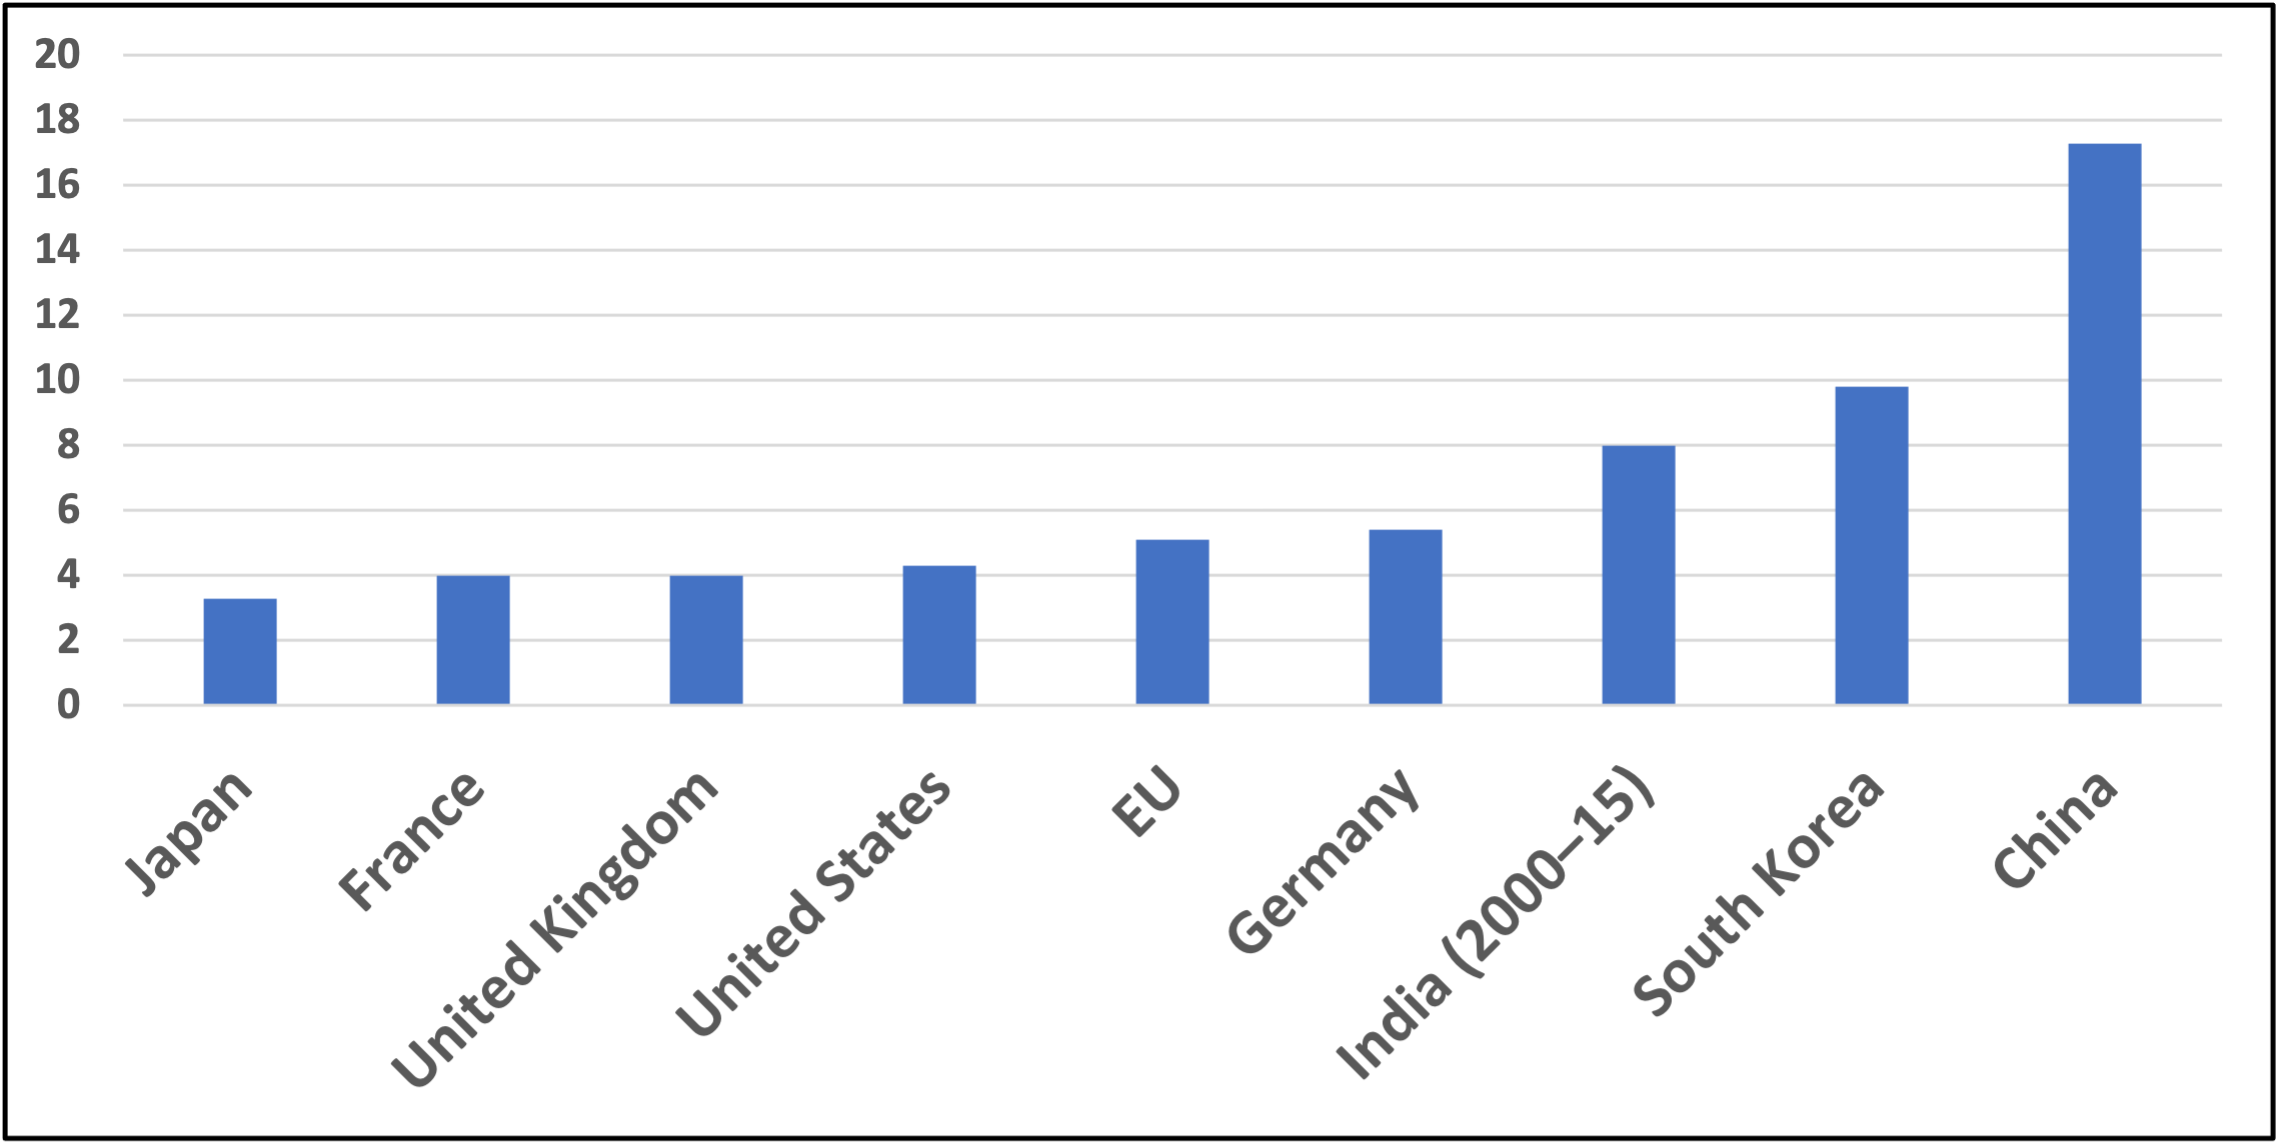
Source: NSF, National Science Board, Science & Engineering Indicators 2020, The State of US Science andEngineering 2020, Figure 13, p. 9. Data sourced from NCSES, National Patterns of R&D Resources; OECD, Main Science and Technology Indicators 2019/1; UNESCO Institute for Statistics, Research and Experimental Development.
Figure 2. R&D Spending by Select Countries Over Time. (Gross expenditures, not normalized as a percent of GDP.)
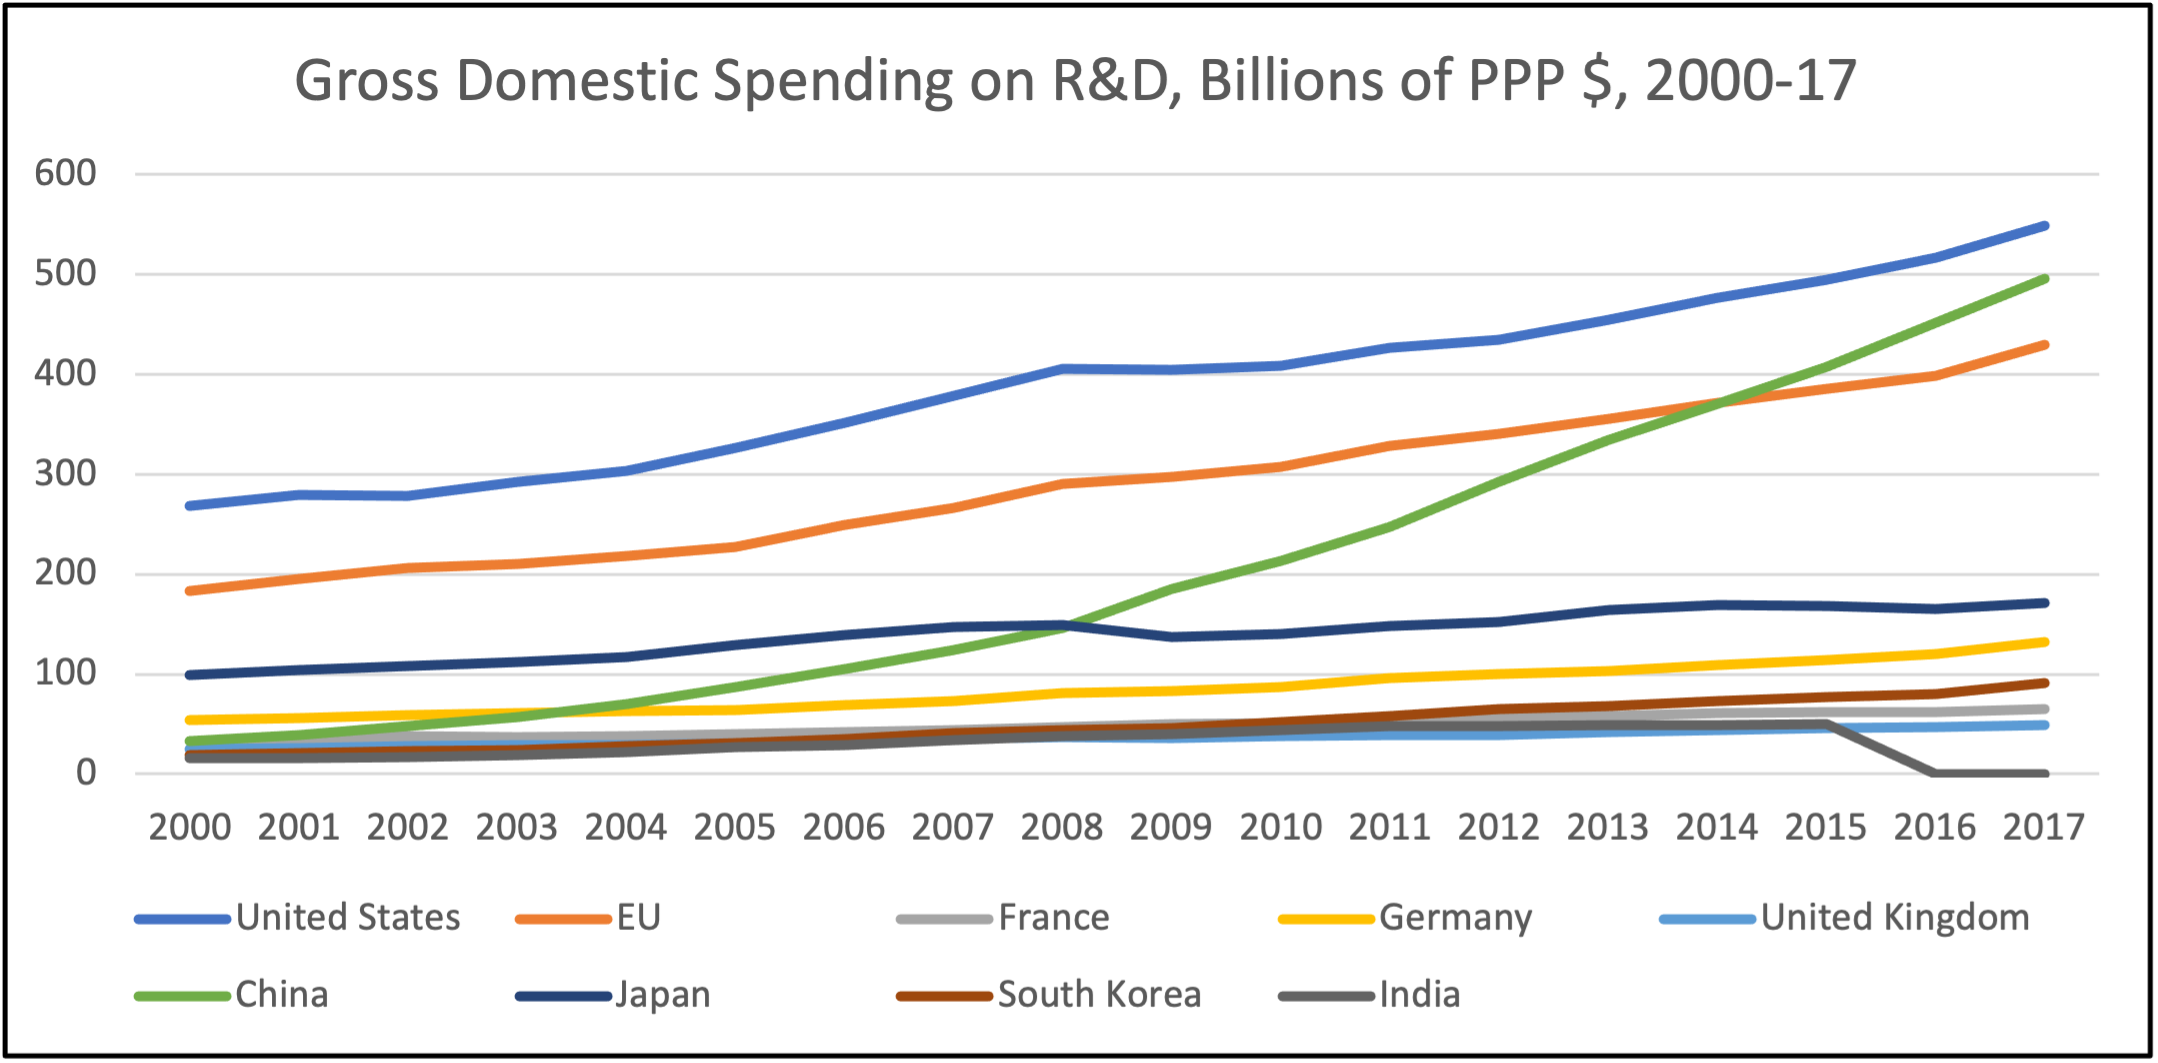
Source: NSF, National Science Board, Science & Engineering Indicators 2020, The State of US Science and Engineering 2020, Figure 11. Data from NCSES, National Patterns of R&D Resources; OECD, Main Science and Technology Indicators 2019/1; UNESCO Institute for Statistics, Research and Experimental Development.
Figure 3. US R&D Expenditures, by Performing Sector 2000-2019

Adapted from: NSF, National Science Board, Science & Engineering Indicators 2020, The State of US Science and Engineering 2020, Figure 16. Data from NCSES, National Patterns of R&D Resources.
A strategy of fast-following is more profitable, but is not aligned with a national imperative of establishing an enduring competitive posture.
 Recommendation 1
The United States must prioritize investment in basic science, R&D, and American people—particularly in scientists and engineers—to remain competitive in a global environment. This means increasing the US federal investment and developing policies that favor industrial investment.
Mega Trends in STEM Performance
Succeeding in a technological competition relies on people—scientists, mathematicians, data analysts, and engineers—in a workforce that drives the technology progress engine. Continuing signs indicate that the state of technological literacy in the US has been surpassed by other nations and is declining domestically. The impact of the shift in emphasis on R&D is manifest in student performance seen as early as middle school. The 2018 OECD Program for International Student Assessment (the PISA score) assessed the performance of 15-year-old students in math, science, and reading, and the results showed US deficiencies4. In fact, the US students’ performance fails to keep pace with results in such diverse nations as China, Estonia, Canada, and Poland in all three assessed categories. Moreover, the US students’ performance shows continued erosion over time.
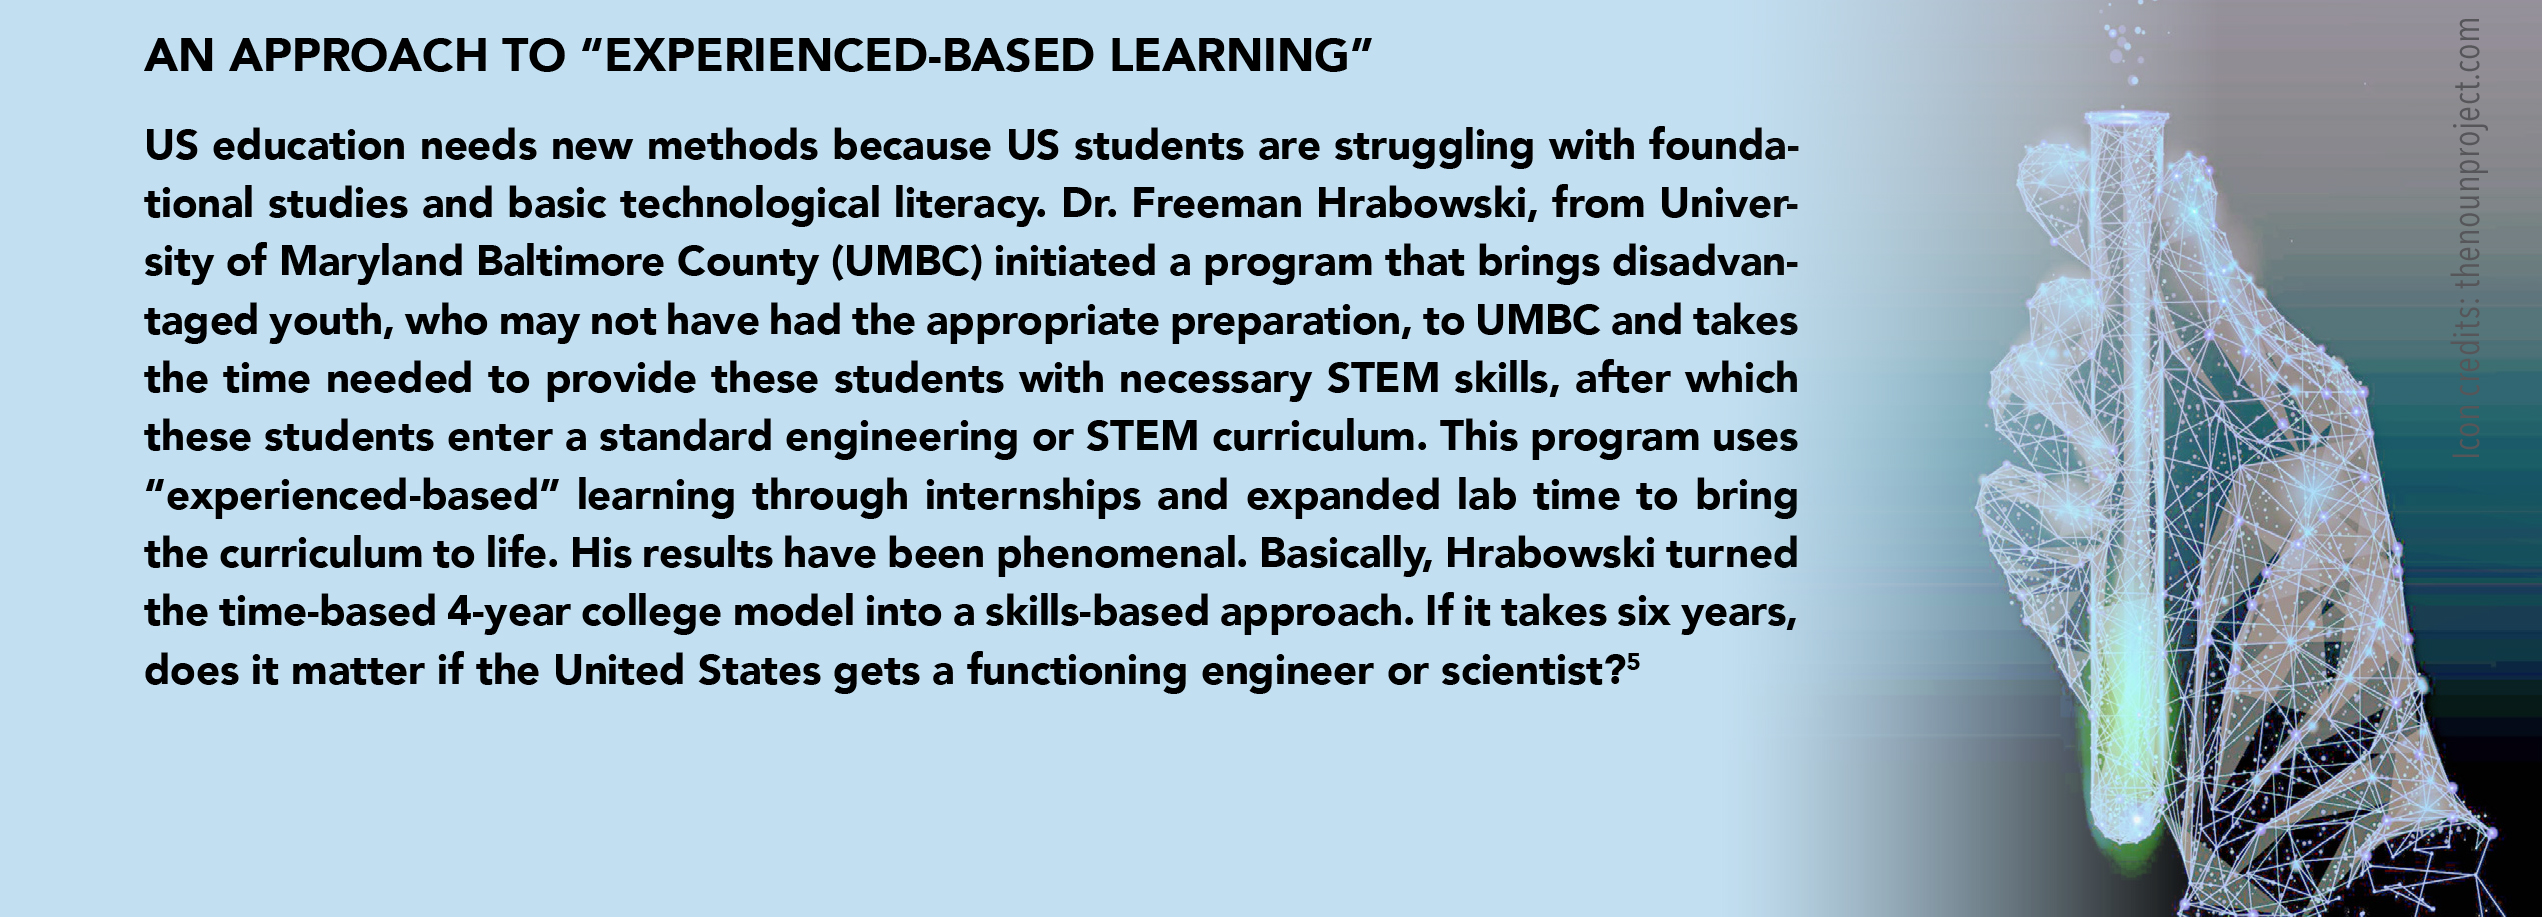
An Approach to “Experienced-based Learning”
US education needs new methods because US students are struggling with foundational studies and basic technological literacy. Dr. Freeman Hrabowski, from University of Maryland Baltimore County (UMBC) initiated a program that brings disadvantaged youth, who may not have had the appropriate preparation, to UMBC and takes the time needed to provide these students with necessary STEM skills, after which these students enter a standard engineering or STEM curriculum. This program uses “experienced-based” learning through internships and expanded lab time to bring the curriculum to life. His results have been phenomenal. Basically, Hrabowski turned the time-based 4-year college model into a skills-based approach. If it takes six years, does it matter if the United States gets a functioning engineer or scientist?5
How can a nation that birthed the information technology era, developed the semiconductor and computer industries, and landed the first man on the moon—and that spends so much on education—be in a competitively disadvantageous position?
 Recommendation 2
Fund the expansion of Dr. Freeman Hrabowski’s University of Maryland Baltimore County model to other universities to expand the pool and diversity of domestic STEM students.
The economic incentives have not favored continued US dominance in basic (university) research in science and technology, and maintenance of US leadership in R&D globally. Culturally, we might contend that the United States has tended to value the accumulation of wealth, at least in the last few decades, over the accumulation of knowledge.
Past examples of great US scientific and engineering achievements were often accomplished with the aid of foreign-born scientists working within the United States. The making of the atomic bomb (the Manhattan project), the Apollo program to land humans on the moon, and human genome mapping leveraged basic science advances to make significant technological achievements. None of these would have been possible without non-US born scientists and engineers. The United States benefited from an influx of European physicists and mathematicians, German rocket scientists, Jewish immigrants, as well as many first- and second-generation scientists and engineers educated in the United States.
Cultural differences may be reflected in graduate student demographics. Forty years ago, most hard science and engineering students were US citizens. From 1980 to 2020, the number of international graduate students in US universities rose from about 90,000 to 350,000 today—most in the hard sciences6. Over the same period, the total number of US university students rose by about 33%. Sources state that in 2017, 82% of electrical and petroleum engineering students were international, as were 72% of computer science, 71% of industrial engineering, and 70% of statistics graduate students in the US7. Yet more US graduate students are foreign-born US residents. Fortunately, stay-rates of foreign graduate students (i.e., the percent that remain in the United States after graduation) have increased, in part because of the 3-year “Optional Practical Training” program, with over half employed in STEM fields8.
The suggestion is that foreign cultures might value STEM education more than Americans, and that STEM fields are difficult and less appealing to US students. In a recent panel, Professor Dan Hastings from MIT said “STEM is hard, that is ok. It can also be fun.” To get more US citizen students into the STEM pipeline, the United States may need to better encourage its young people to enjoy that hard work.
Cultural differences are accompanied by decreases in government funding support for R&D, which was reduced at the conclusion of the Cold War as part of the Peace Dividend. Government and military focus on global counterinsurgency after the 9/11 attacks stalled federal commitments to basic research in science and technology, in favor of more applied developments. These and other macroeconomic trends in US R&D investments were accompanied by large increases in R&D investments in science and technology by other nations, particularly China.
 Recommendation 3
America has always been a nation built by bringing in the best from the world, which should remain a path forward today. The US government needs to examine how to enhance the number of H-1B visas given out to foreign students, and endeavor to bring them into US industry, academia, and select government positions.
The Economic Landscape of US Education:
The Impact of Income Inequality
Education is America’s key to establishing an enduring competitive advantage in science and technology. Before investments in research and development can be considered, the United States must reconsider how it invests in young people and how it funds education.
Public schools in the United States for kindergarten through 12th grade (K through 12) are largely funded by local sources: county and state. They are funded municipally by revenues gathered from property taxes (44% of total funding on average), and a portion of state tax revenues (income taxes and/or sales taxes) to account for another 48%, on average9.
Federal funding nationwide amounts to 8% of the sector. Public education is more likely to be well-funded in districts with valuable properties and in richer states. Conversely, schools located in poorer neighborhoods tend to have less funding, and those students who may need the most financial help are less likely to receive it.
The model of local financing of schools introduces a feedback loop. In the United States, one of the significant contributors to property value is access to “good” schools. The National Bureau of Economic Research discovered on average that “for every $1 spent on school funding, property values increased by around $20.10” In this case, districts that have historically good schools see their funding increase, which leads to higher property values, which leads to more revenues to fund their schools. In Los Angeles, for example, homes in a “top-tier” school district sell for an average of 79% more than homes in an “average school district nearby.11” This relationship has stratified the quality of public education across the country.
New models of financing education may be needed. Sometimes municipalities attempt to innovate entirely new systems of public education (e.g., charter schools)12. Ultimately, the US needs a quality education system, which requires facilities and high-quality teachers. Education is costly, but it benefits the nation; the locality; and primarily, the educated person.
Private schools and private universities offer choice but are largely funded by tuition13. Elite universities also collect overhead on research, gifts, and endowments. State universities receive support from state resources to benefit the local population (employment, businesses, etc.). But, tuition payments (and room and board payments when appropriate) fund the administrative operations and education processes of private schools and universities.
The price of college in the United States has exploded over the last few decades. One analysis shows a constant dollar increase by a factor of 2:1 in average college costs from 1990 to 202114. In a recent survey, 37% of American college applicants and 64% of parents, estimated that the costs of college are more than $100,00015. Total costs of attending a 4-year college can vary widely, but students who do not pay full fare are expected to take on loans. The current average federal student loan debt balance is more than $37,000, totaling over $1.6 trillion across Americans16. The amount of debt that a post-secondary student will incur depends greatly on the type of university, living arrangements, and the educational requirements of the program. If more than four years are required, as is often the case for STEM majors, the education will be more costly. The debt burden is not good for America17, but that is a separate issue. Financing models that encourage those who are not extraordinarily wealthy to take on debt greatly impact the choices made by US students contemplating their post-secondary education, which can contribute to a decline in US STEM talent.
US funding for education and incentives that influence student choice are important issues that need addressing. We also need to consider why college costs have risen so drastically.
One factor is the transition of higher education towards a competitive market landscape, where schools are incentivized to market themselves as something “more” than an educational institution. Athletics, amenities, and administrative support have broadly evolved into the leading factors in many students’ decision for enrollment—including the cultural artifact of the “college experience.” Given the choice between a school that offers a quality education and a school with an inferior quality but a “once in a lifetime social experience,” many students choose the latter. This trend is counter to the United States’ goal of cementing an enduring competitive advantage in STEM.
Another factor is that colleges and universities are incentivized to prioritize students that can pay full tuition. Today, the US can claim many world-class academic institutions that attract students from around the world who are able to pay full tuition. While most colleges state that they are “need-blind,” drawing on a worldwide pool of applicants reduces the need to offer discounting (through scholarships) to qualified applicants. Since foreign students do not always stay in the US18, this also undermines the country’s competitive advantage in STEM fields.
State funding for public universities has declined in the past decade by roughly 13% per student19, motivating tuition increases. Ironically, the availability of student loans contributes to tuition increases by removing some pressure for cost containment20. Increased access to higher education, in part due to the availability of low interest loans21, has increased demand on universities overall, which also results in higher tuition rates.
Scholarship for Service
A number of “scholarship for service” programs have funded the higher education of US students. In this model, the sponsor pays tuition, board, books, and even a stipend, in exchange for a guaranteed number of years of service to the sponsor following graduation (typically in a ratio between one or two years of service per year of sponsored education). In the US national security domain, the Department of Defense (DoD) has the Reserve Officer Training Corps program and the Science, Mathematics and Research for Transformation (SMART) program22. These programs provide military officers and civilian scientists and engineers advanced education for future employment in the DoD. The FBI and the intelligence community have similar programs. These types of programs could be expanded to other government agencies and industry. In addition to student service commitments, tax incentives or credits could further motivate industry to adopt such programs. In so doing, the nation could reduce future debt burdens and produce more scientists and engineers.
The Cultural Landscape of US Education
The prevailing wisdom, historically, is that one must go to a university and obtain a degree to be “successful” in life. This perception is true, based on many studies of lifetime earnings23. As a hiring filter, employers increasingly require a bachelor’s degree24. The return on investment provided by a university degree is complex, and not universally accepted as a great deal; wage growth has been stagnant, and unemployment rates among recent graduates have been high25. Still, an undergraduate degree is undoubtedly a good deal—for both the student and the nation.
Whether due to perception or requirements, college enrollments increased rapidly from 1970 to present. In 1970, 7.4 million students were pursuing higher education in the US, and by 2010 this number had increased to 21 million26. (Interestingly, the number has plateaued since, with the pandemic causing further “great interruption” in enrollments.27)
Motivations for higher education are changing. In one survey, over 86% of college first-years believed that “[being] able to get a better job” was “very important” in their decision to attend college, compared to the fewer than 60% that claimed “[preparing] myself for graduate or professional school” was equally as important28. Similarly, according to this same study from UCLA, the rate of respondents saying that “to make more money” was “very important” increased from 44.5% from 1971 to nearly 73% in 201429. These trends in survey responses highlight a cultural shift towards an emphasis on financial rewards. Students may be highly motivated to pursue post-secondary education, but not to major in difficult STEM fields.
An education in STEM does not always translate to employment in STEM. The US Census Bureau states that out of the 50 million employed college graduates ages 25-64 in the US in 2019, “37% reported a bachelor’s degree in science or engineering, but only 14% worked in a STEM occupation.30” Graduates in STEM fields are in high demand, but not necessarily for STEM occupations. Management consulting firms and financial institutions seek students from elite institutions, observing that the talent pool is small and competitive, and “STEM professionals have become an integral part of the workforce in the finance arena… 31.” Exceptional pay and benefits tempt graduates away from a career in the sciences to pursue other more lucrative opportunities.
The situation is slightly different for international students in the US. For visa reasons, foreign graduate students must maintain full study loads during school and are less likely to be recruited to a non-STEM career if they stay in the US with a STEM degree. Perhaps as a result, over half of US engineering and computer science workers with a graduate degree are foreign-born (see Figure 4)32.
The cultural milieu in the United States has evolved significantly over the last half-century. Against the backdrop of the numerous economic pressures facing students and young people in the United States, there is cause for concern about the future of American competitiveness. Although rectifying the current situation is a monumental challenge, it is a challenge worth undertaking.
Figure 4. Foreign-born Individuals in Science and Engineering Occupations in US by Education Level.
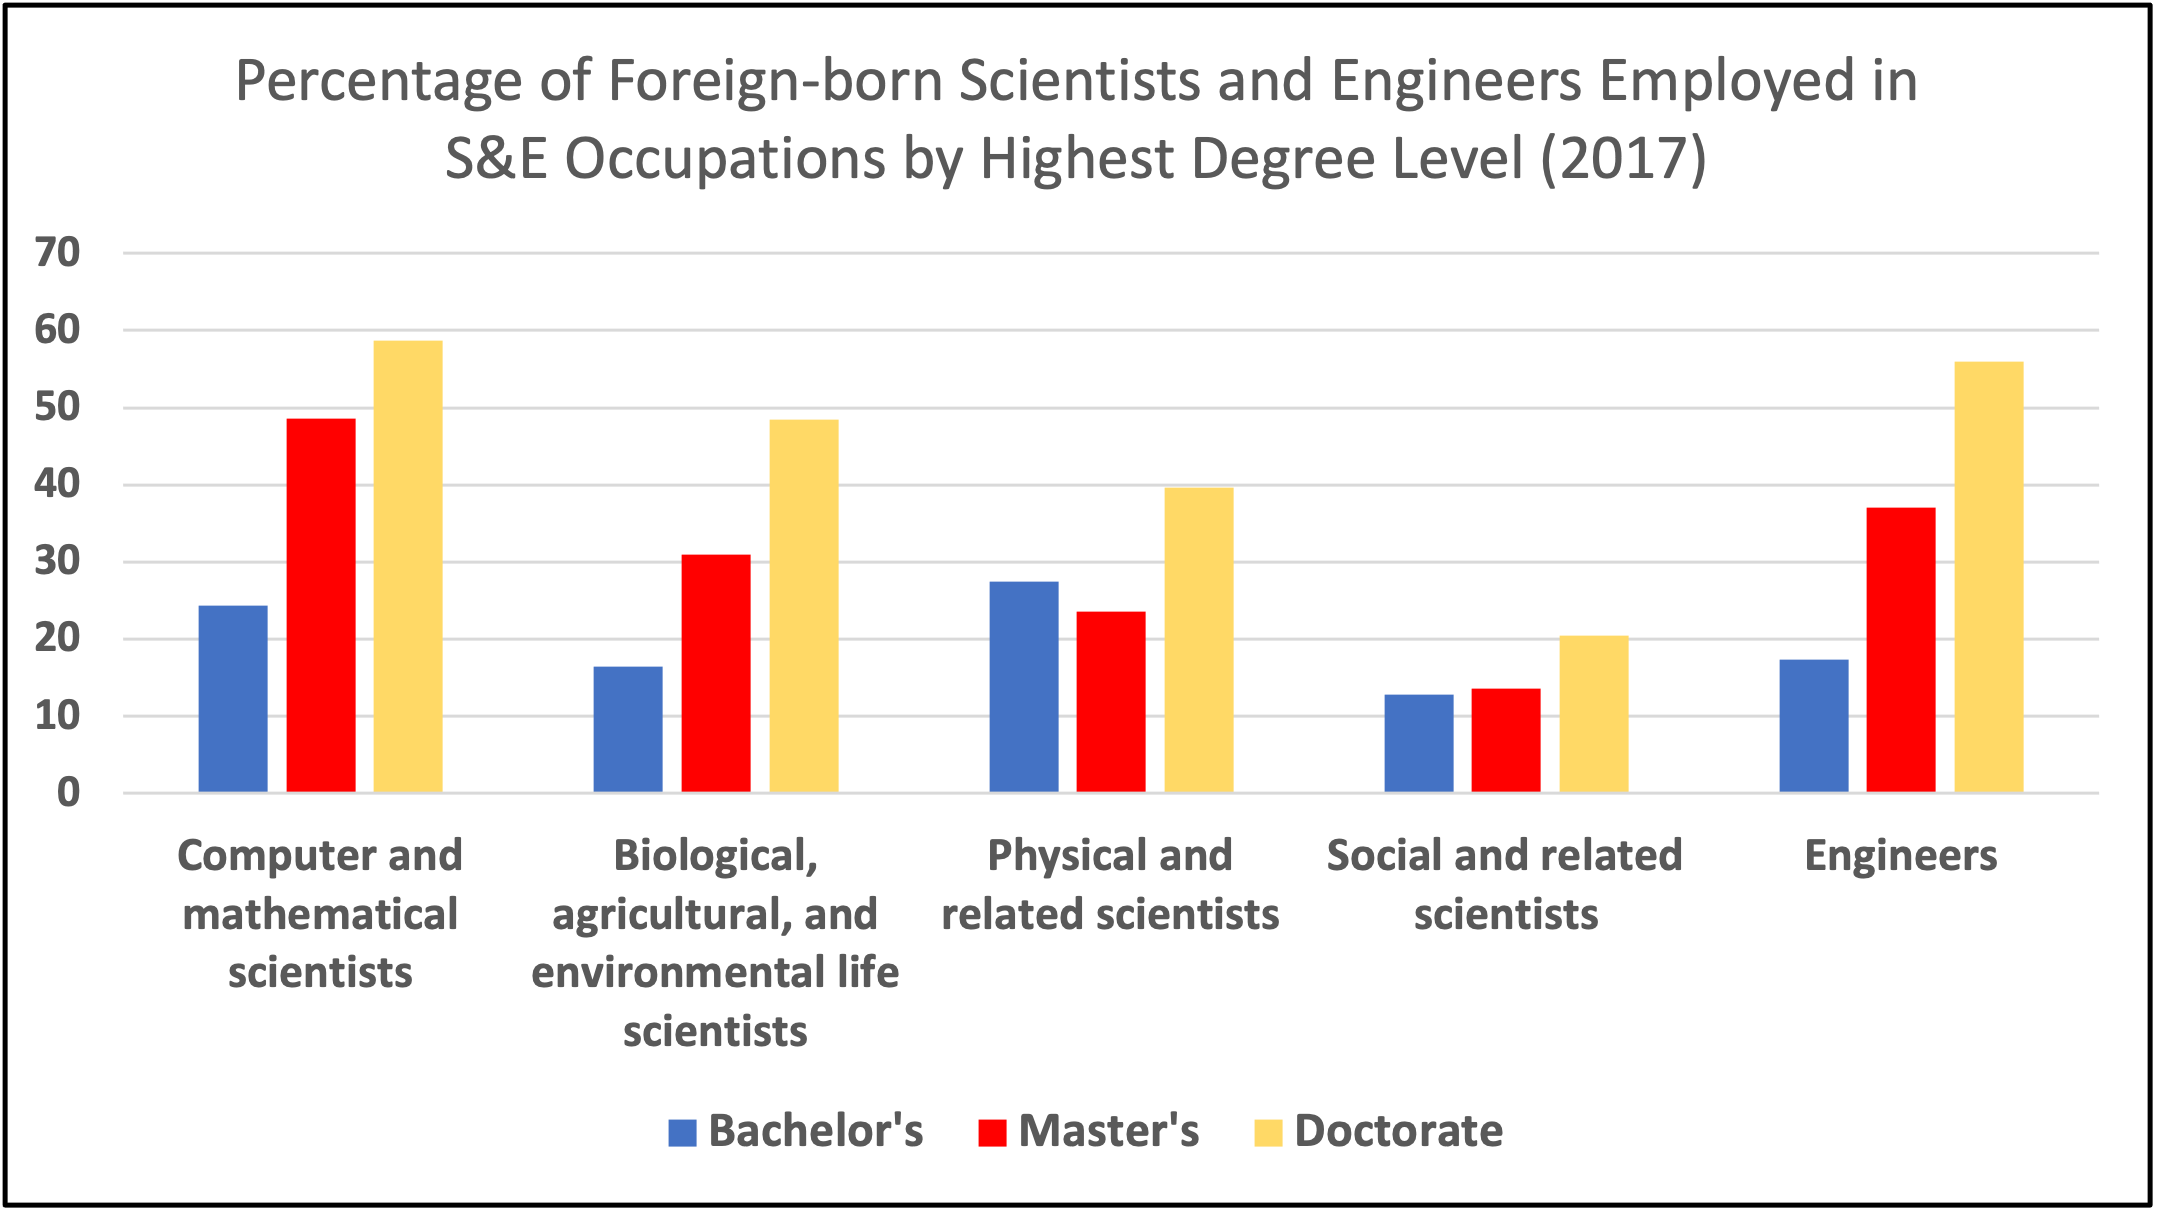
Source: NSF, National Science Board, Science & Engineering Indicators 2019, Science and Engineering Labor Force, Figure 3-24. Data from National Center for Science and Engineering Statistics, National Science Foundation, National Survey of College Graduates (NSCG), 2017.
The Factors for Migration Away from STEM Fields
In a recent forum of the Potomac Institute’s Global Competition Project, panelists suggested reasons as to what could be driving the migration of American students to non-STEM fields.
The overriding reason, as suggested, is financial. The overwhelming cost of attending college in the US incentivizes students to pursue degrees outside of STEM, or to drop from STEM programs after beginning them, because they “cannot afford to fail and retake courses.” Regardless of their talent or primary school experience, a STEM degree may be perceived as too risky given the burden of debt that will cripple them financially. They pivot their focus towards a subject area they believe is “easier” and less risky. One study in 2019 found that over 60% of college students dropped out of their STEM programs33. It is reasonable to suggest that students feel more likely to graduate with a degree in social sciences, humanities, and business.
Another factor for the migration away from STEM fields, brought up by the panelists, was the practice of introductory courses whose purpose is to “weed-out” weaker students. The suggestion is that STEM 101 courses are not designed to best prepare students for matriculation through their major but are designed to optimize the allocation of educational resources to a select few34. The selection process may be counter to the United States’ goal of an enduring competitive advantage in STEM fields.
Class size may be another factor. In STEM disciplines, especially in introductory courses, large lecture-hall classes can be common, ranging in size from 100 to 500 students—with extremes of up to 1,000 students35. Quality and interactivity suffer, for efficiency. A 2021 study of the impact of class size on college students in the UK noted that large class sizes are “associated with significantly lower grades.36” Talent in STEM may be lost as students migrate to other fields with more social experiences.
Employment opportunities and starting salaries play a role. Today, the highest paying tech jobs (those positions that demand STEM degrees) are in advertising optimization, social networking, workplace efficiency, quantitative investment analysis, payments processing, and other data analytic applications37. These businesses generally do not contribute to the US’ competitive advantage in STEM, but they attract investments from venture capital and, thus, recruit the best STEM graduates38.
Today, many of the high-tech start-up companies that employ recent STEM graduates aim to be acquired by larger established companies. The start-up companies are not in the mold of large research enterprises of old, such as Bell Labs, Xerox Parc, Intel, or an early Apple. Instead, the start-ups focus on “quick wins” and demonstrations, and often do not persist at knowledge development after acquisition. STEM employees then migrate to other start-ups, or non-STEM endeavors.
To be competitive in the future economy of the world, the US cannot afford to have STEM students migrate to other fields and endeavors before their talent is discovered. The nation needs a larger cohort of students to matriculate through STEM education and to become gainfully employed in technology development for societal purposes to participate in the future economy.
A Braided River Model of Education
Today, education and career development in the US can be represented as a pipeline, i.e., a linear progression through elementary, secondary, undergraduate, and graduate education into a career. This model has been under question for some time.
An Economist magazine special report from 2017 proposes a changed viewpoint in the educational model39. Contrary to time-based block learning, where a person attends programs for a fixed number of years, the changed viewpoint constitutes a more “continuous learning” model. Many career fields operate this way already, for example, medicine, law, engineering, and accounting. In these fields, more experiential learning occurs up front with frequent refreshers, updates, and certificate credentials throughout a career.
This new model may be thought of as a braided river model (Figure 5), as envisioned by authors of a recent EOS article on STEM workforce development40. Continuous learning serves as an analog for the way we can view a typical career, with an “inclusive, responsive, and modern career development” process. The concept is to allow individuals to move along and in between multiple entry points through a STEM career, in distinction to a time-dictated “pipeline” that has only one main entry point, namely higher education. Partnerships among academia, government, and industry could allow for multiple entry points into STEM at any readiness level.
Figure 5. Illustration of the “Braided River Education Model for STEM.”
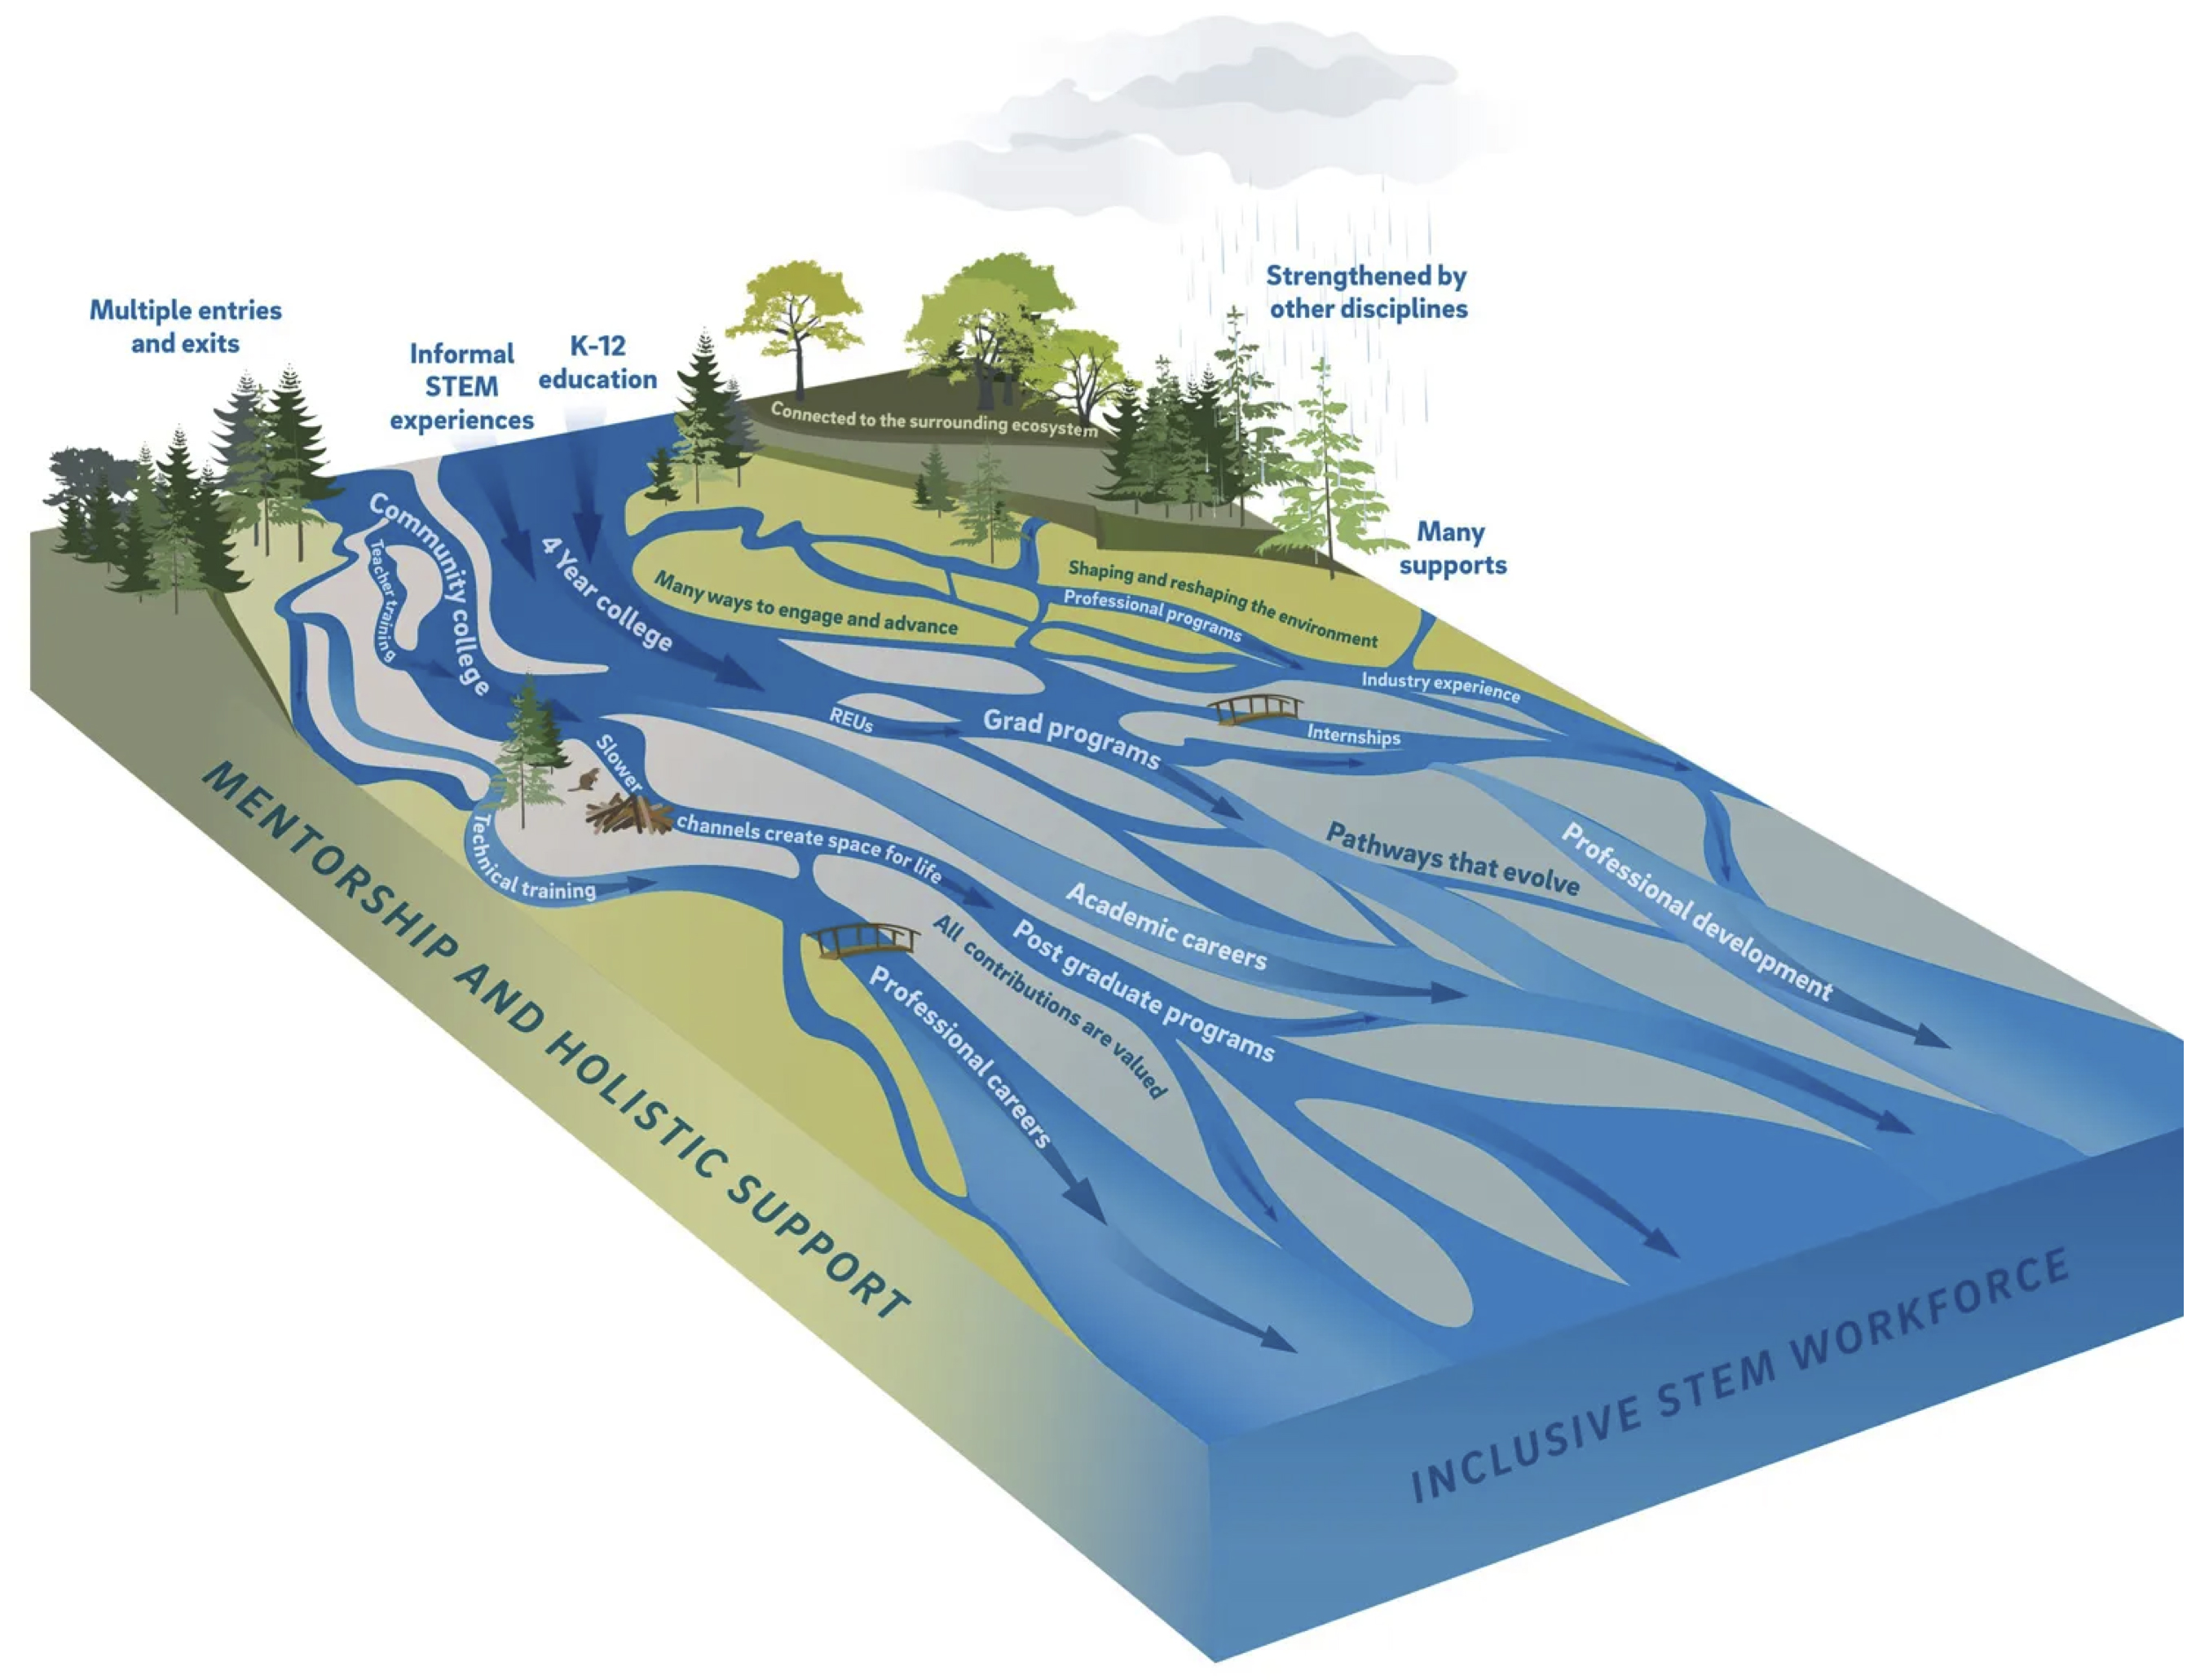
Printed with permission. EOS, Reimagining STEM Workforce Development as a Braided River. Credit: Jennifer Matthews via EOS.org.
The model implies a very different approach to educational investments and funding. Much of the advanced education becomes the shared responsibility of the student and employer. Employment models such as the Military Reserve Officer Training Program and SMART (see Scholarship for Service insert, page 25) make tuition payments for advanced education. The GI bill has supported numerous college educations. Other scholarship and tuition payment service programs might accompany careers outside of the military. Government service might include student loan payments in pre-tax dollars. Mentorships, training programs, academic courses, and deployment mobility could provide greater freedom for people of all ages and career stages to pursue lifelong STEM careers and to contribute to US competitiveness in the future economy. Removing current disincentives for STEM development and replacing them with motivations and opportunities would require a major shift in investments in education and the associated funding models.
Conclusion
The United States should strive to expand its leadership on the world stage in science and technology. In the past, its position as the eminent leader in these fields provided a historically unprecedented quality of life for the average citizen and has been the foundational building block in its provision of national security. Policy-driven economic pressures should not be the reason that the United States loses its global competitive advantage. The US government needs to address the economic underpinnings of education to build a foundation for an enduring competitive advantage in STEM.
At the base of technological competition are people—the scientists, mathematicians, data analysts and engineers that drive the technological progress engine. If the US is to reestablish an enduring competitive advantage in STEM and technology, national education process reforms will be needed. Serious reconsideration of the federal government’s relationship with both the private sector and state and local education will be required. The United States has the talent, universities, laboratories, and infrastructure to succeed, and to lead the world in technology development through superior research and science. However, disincentives and barriers to effective career development through STEM education must be overcome. Investments in education and career development within US enterprises of the young, talented, and motivated are necessary to establishing an enduring competitive advantage in science and technology.
Endnotes
1. Rogier Creemers, et al. “Translation: 14th Five-Year Plan for National Informatization – Dec. 2021.” DigiChina. Stanford University. January 24, 2022.
2. American Association for the Advancement of Science. “Historical Trends in Federal R&D.” October 2020.
3. The National Science Foundation. “The State of U.S. Science and Engineering 2022.” January 2022.
4. Organization for Economic Co-operation and Development. “PISA 2018 Results, Combined Executive Summaries.” 2019.
5. Freeman Hrabowski. “Hrabowski: An Educator Focused on Math and Science,” Interview by Byron Pitts. 60 Minutes November 13, 2011.
6. Open Doors. “Academic Level.” Sponsored by the U.S. Department of State with Funding Provided by the U.S. Government and Supported in its Implementation by IIE. 2021.
7. Elizabeth Redden. “Report Focuses on Graduate International Enrollment,” Inside Higher Ed. August 19, 2021.
8. Neil G. Ruiz and Abby Budiman. “Number of Foreign College Students Staying and Working in U.S. after Graduation Surges.” Pew Research Center’s Global Attitudes Project. Pew Research Center, August 14, 2020.
9. Grace Chen. “An Overview of the Funding of Public Schools.” Public School Review, March 31, 2022.
10. Lisa Barrow and Cecilia Elena Rouse. “Using Market Valuation to Assess Public School Spending.” National Bureau of Economic Research. July 2002.
11. Barrow and Rouse. “Using Market Valuation.”
12. Ballotpedia: The Encyclopedia of American Politics. “Charter Schools in New York.” Ballotpedia. March 12, 2022.
13. Nathan Paulus. “How to Pay for a Private School Education.” MoneyGeek.com. May 12, 2022.
14. Jennifer Ma and Matea Pender. “Trends in College Pricing and Student Aid 2021.” New York College Board. 2021: p. 12.
15. The Princeton Review. “2022 College Hopes and Worries Survey Report.” 2022.
16. Melanie Hanson. “Student Loan Debt Statistics.” The Education Data Initiative. May 30, 2022.
17. Melanie Hanson. “Average Time to Repay Student Loans.” The Education Data Initiative. December 16, 2021.
18. Xueying Han, et al. “Will They Stay or Will They Go? International Graduate Students and Their Decisions to Stay or Leave in the U.S. upon Graduation.” PLoS One. NIH National Library of Medicine. March 11, 2015.
19. Michael Mitchell, et al. “State Higher Education Funding Cuts Have Pushed Costs to Students, Worsened Inequality.” Center on Budget and Policy Priorities. October 24, 2019.
20. David O. Lucca, et al. “Credit Supply and the Rise in College Tuition: Evidence from the Expansion in Federal Student Aid Programs.” Federal Reserve Bank of New York. July 2015, revised February 2017 .
21. Bhutada Govind. “The Rising Cost of College in the U.S.” The Visual Capitalist. February 3, 2021. Citing U.S. Bureau of Labor Statistics data.
22. Smart Scholarship Program. “SMART Scholarship for Service Program,” May 2022; Todaysmilitary.com. “ROTC Programs – Today’s Military,” 2019.
23. William R. Emmons, et al. “The College Boost: Is the Return on a Degree Fading?” Federal Reserve Bank of St. Louis. July 17, 2018.
24. Joseph Fuller. “Why Employers Must Stop Requiring College Degrees for Middle-Skill Jobs,” Harvard Business School Opinion December 18, 2017.
25. Brandon Busteed. “The Convincing and Confusing Value of College Explained,” Forbes Magazine September 3, 2019.
26. Melanie Hanson. “College Enrollment & Student Demographic Statistics.” The Education Data Initiative. April 22, 2022.
27. Bill Conley and Robert Massa. “The Great Interruption,” Inside Higher Ed. February 28, 2022.
28. Catherine Rampell. “Why Do Americans Go to College? First and Foremost, They Want Better Jobs,” Washington Post February 17, 2015.
29. Rampell. “Why Do Americans Go to College?”
30. Jennifer Cheeseman Day and Anthony Martinez. “STEM Majors Earned More than Other STEM Workers.” United States Census Bureau. June 2, 2021.
31. Amy Meadows. “A Sign of the Times – How the Finance Industry is Embracing STEM Professionals” Bloomberg. August 28, 2017.
32. Amy Burke, et al. “The State of U.S. Science and Engineering 2022.” National Science Foundation, National Science Board. 2022.
33. Student Research Foundation. “Why Do 60%+ of College Students Drop out of STEM Programs?” December 3, 2019.
34. Dalmeet Singh Chawla. “Surviving Weed-Out Classes in Science May Be a State of Mind.” New York Times November 16, 2020.
35. The University of California Berkeley, Office of the Vice Chancellor of Finance. Our Berkeley, “Class Size.” 2022. OPA – University of California Berkeley.
36. Elif Kara, Mirco Tonin, and Michael Vlassopoulos. “Class Size Effects in Higher Education: Differences across STEM and non-STEM Fields.” Economics of Education Review (82) June 2021.
37. BuiltinSF.com. “50 Best Paying Companies in the Bay Area 2021.” 2021.
38. Statista Research Department. “Value of Venture Capital Investment in the U.S. 2021, by Industry.” Statista. April 13, 2022.
39. The Economist. “Lifelong Learning is Becoming an Economic Imperative.” January 14, 2017.
40. R. L. Batchelor, et al. “Reimagining STEM Workforce Development as a Braided River” EOS 102 April 19, 2021, See: https://eos.org/opinions/reimagining-stem-workforce-development-as-a-braided-river.
